Last updated: 22 November 2026
Share of voice in branding is the percentage of total advertising, media or online conversation a brand owns within its category, measured against its competitors. The concept matters because of one well-documented pattern: for every 10 percentage points of excess share of voice a brand achieves above its market share, it can expect an average market share gain of 0.5% per year, according to IPA / Les Binet and Peter Field (2007).
Key Takeaways
- Share of voice (SOV) measures a brand's percentage of category advertising, media mentions or search presence compared with competitors, not its sales.
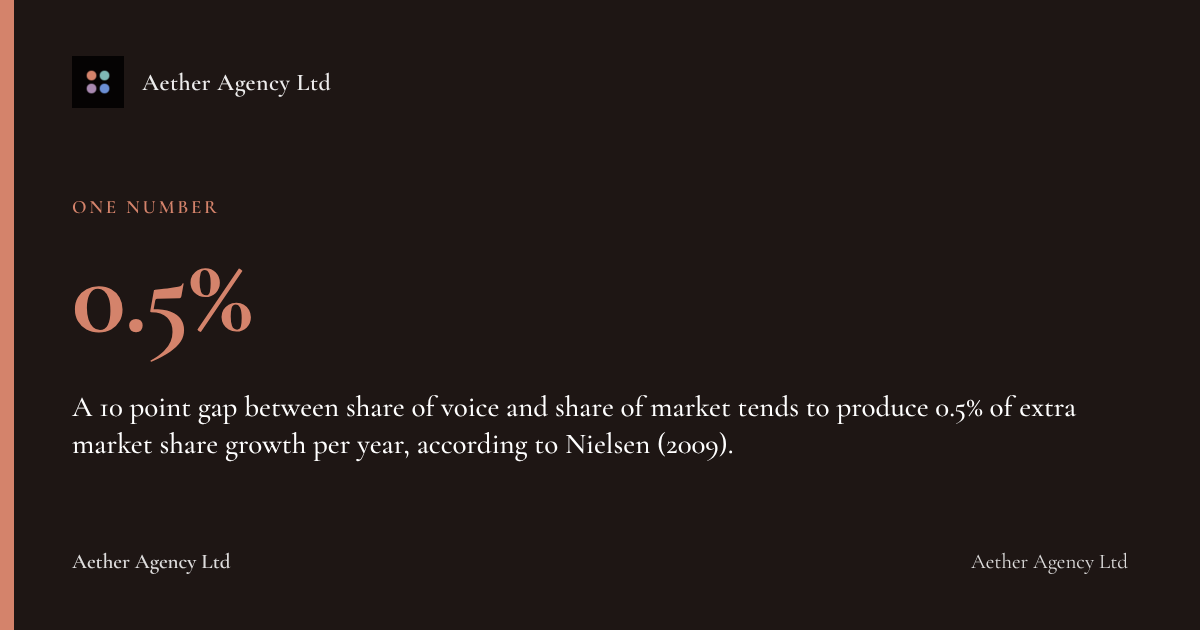
- A 10 point gap between share of voice and share of market tends to produce 0.5% of extra market share growth per year, according to Nielsen (2009).
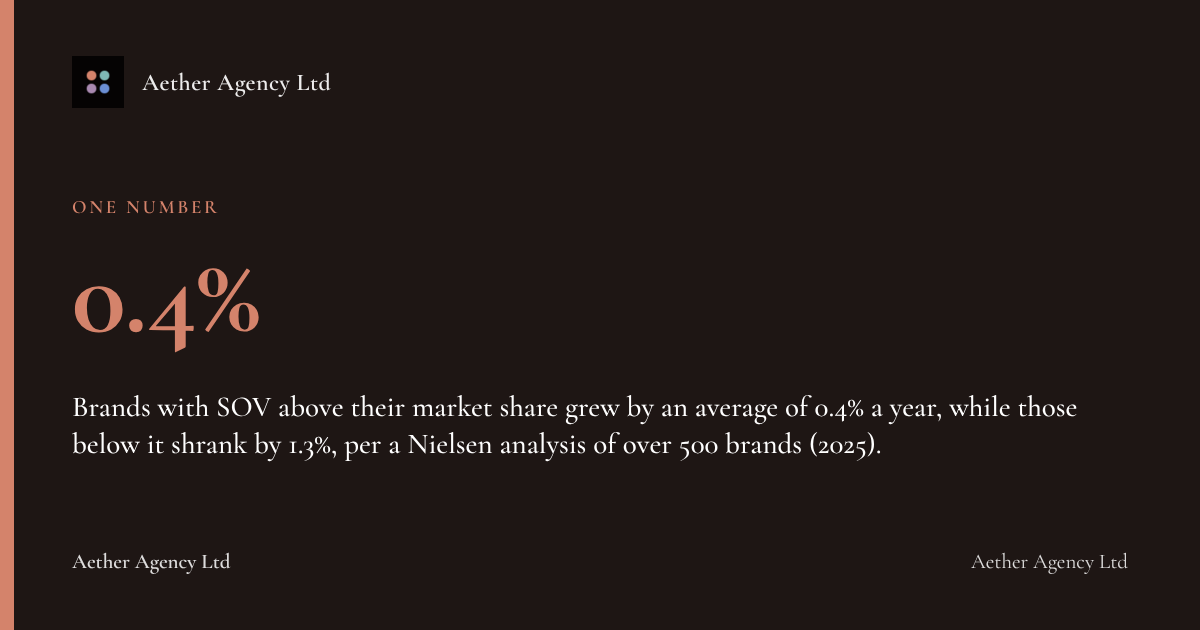
- Brands with SOV above their market share grew by an average of 0.4% a year, while those below it shrank by 1.3%, per a Nielsen analysis of over 500 brands (2025).
- Share of search, the proportion of category search volume a brand captures, represents 83% of a brand's market share on average, according to the IPA Share of Search Think Tank (2021).
- The same 10% excess share of voice rule drives 0.7% annual market share growth in B2B markets, according to the LinkedIn B2B Institute and Les Binet and Peter Field (2026).
What is share of voice?
Share of voice is a brand strategy metric that expresses how much of a category's total advertising spend, media coverage, social mentions or search demand belongs to one brand rather than its rivals. It is usually shown as a percentage: if a number of competitors share the total advertising spend in a category and one brand accounts for a portion of that, its share of voice reflects that proportion.
The metric sits alongside share of market (SOM), the brand's actual percentage of category sales or revenue. Comparing the two produces excess share of voice (ESOV), the gap between a brand's share of voice and its share of market, which is the single most studied number in this field.
Les Binet and Peter Field's analysis of the IPA Databank, first published in 2007, established that ESOV correlates with future market share growth more reliably than almost any other marketing input. Nielsen's own 2009 study of 123 brands across 30 categories confirmed the pattern independently, giving the theory two separate evidence bases rather than one.
How does share of voice differ from share of market?
Share of voice measures visibility; share of market measures sales, and the gap between the two predicts which way a brand's fortunes are heading. Nielsen found that a brand with 20.5% market share and an ESOV of 10 points would grow to roughly 21% market share over a year, according to Nielsen (2009).
| Metric | What it measures | Typical data source |
|---|---|---|
| Share of voice (SOV) | % of category media spend, mentions or search a brand owns | Ad spend trackers, PR monitoring, social listening tools |
| Share of market (SOM) | % of category sales or revenue a brand holds | Sales data, Kantar/Nielsen panels, industry reports |
| Excess share of voice (ESOV) | SOV minus SOM | Calculated from the two figures above |
| Share of search | % of category search demand a brand captures | Google Trends, Keyword Planner |
This distinction matters for UK marketing directors setting budgets ahead of financial year planning. A brand spending in line with its market share is simply maintaining position; a brand spending above it is actively buying growth.
Why does excess share of voice predict market share growth?
Excess share of voice predicts growth because advertising works cumulatively, building mental availability faster than a rival whose spend merely matches its current size. A Nielsen analysis of over 500 brands found that brands with SOV higher than SOM grew market share by an average of 0.4% each year, while brands with SOV below SOM saw market share shrink by an average of 1.3% (2025).
IPA research spanning more than 1,400 effectiveness case studies reached a similar conclusion: brands holding SOV above their market share percentage tend to grow, and those below tend to shrink, at roughly 0.5 market share points per year per point of surplus or deficit, according to the IPA effectiveness databank research (2026). The asymmetry (growth of 0.4% against losses of 1.3% in the Nielsen figures) suggests the penalty for under-investing in voice is steeper than the reward for over-investing.
Size also changes the return. Large brands with more than 10% market share get approximately 2.5 times greater return from excess share of voice compared with smaller brands, based on Nielsen FMCG analysis cited in a McCann Demand study (2026). A challenger brand still gains from ESOV, just less efficiently, which is why smaller UK businesses often need sharper creative and positioning, not just more spend, to compete.
"Ranking is attention; converting is trust, and trust comes from specificity. A page that says what a service costs, who it suits and who it does not, will convert visitors a vaguer competitor merely collects. Most content programmes fail commercially because every page is written to be agreeable to everyone, which persuades no one.", Lauren Dawkins, Head of Content, Aether Agency
Does share of voice apply to B2B brands and smaller categories?
Yes, share of voice applies to B2B brands, with 10% excess share of voice driving 0.7% annual market share growth in B2B contexts, according to joint research by the LinkedIn B2B Institute, Les Binet and Peter Field (2026). That figure is notably higher than the 0.5% consumer benchmark, suggesting B2B categories, often less cluttered with advertising, reward a visible brand even more.
Category-specific examples confirm how concentrated voice can get in practice. Verizon captured 18% of the advertising share of voice in the telecommunications market in Q1 2024, a single-brand concentration reported by Opensend (2024). A figure that high in a crowded category signals a brand actively defending or extending its position, not just maintaining it.
For a UK dance academy or an independent butcher, the category is smaller and local, but the mechanics are the same: the business that shows up most often, across the most channels, tends to be remembered first. When Renton Dance Studio needed to reach a younger audience that its traditional digital presence was failing to connect with, Aether Agency Ltd delivered a complete rebrand, website redesign and social media content creation, transforming a dated identity into a modernised one capable of competing for attention against bigger, better-funded rivals.
How has share of search changed how brands measure voice?
Share of search is the proportion of category Google search volume a single brand captures, and it has become a faster, cheaper proxy for traditional share of voice tracking. Research led by James Hankins for the IPA Share of Search Think Tank, spanning 30 case studies across 12 categories and seven countries, found that share of search represents 83% of a brand's market share on average (2021).
That correlation matters because search data is available in real time and free via tools like Google Trends, unlike traditional ad spend monitoring which can lag by months. A UK brand can check its share of search weekly and react to a dip long before quarterly sales figures would reveal a problem.
"Fighting for clicks that are not coming back is wasted energy; the visibility now happens inside the answer itself. The response is to make your pages the source the answer quotes, clear definitions, attributable facts, a named organisation behind them, and to measure mentions and citations alongside visits. The brand named in the answer is winning even on searches that never send traffic.", Lauren Dawkins, Head of Content, Aether Agency
In-house tracking vs agency-led share of voice strategy
Businesses weighing up whether to track share of voice themselves or bring in specialist support face a genuine trade-off between cost and capability. In-house tracking is cheaper and keeps data internal, but most SMEs lack the tools, benchmarking data or time to translate raw SOV numbers into a repositioned brand, a rebuilt website or a content programme that actually shifts search share.
Agency-led strategy costs more upfront but connects the measurement to the fix. Fulk Butchers, a family business in Surrey with no brand identity and no route to online orders, had Aether Agency Ltd build a full brand identity from scratch and deliver an e-commerce website with online ordering, alongside ongoing social media and marketing support, with one team carrying the identity through from packaging to the order confirmation email. On record, Fulk Butchers' online sales are up 180% and its Google rating stands at 4.8 stars (no earlier figure on record for either).
Your share of voice checklist
- Define your category competitors before measuring anything, since SOV is meaningless without a comparison set.
- Calculate your current share of voice across paid media, PR mentions and social content separately.
- Check your share of search monthly using Google Trends against your two or three closest rivals.
- Compare your SOV against your actual share of market to find your excess share of voice (ESOV) gap.
- Prioritise closing a negative ESOV gap before chasing further growth, since Nielsen found underspending brands shrink faster than overspending brands grow.
- Review brand identity and website consistency alongside voice tracking, since a stronger identity converts the attention SOV buys.
- Reassess budget allocation at least twice a year, given how quickly category spend patterns shift.
FAQ
What is share of voice in branding?
Share of voice in branding is the percentage of total category advertising, media coverage or search demand that belongs to one brand compared with its competitors. It is typically expressed as a percentage and tracked over time to judge whether a brand is gaining or losing ground on competitors' spend and visibility.
How do you calculate share of voice?
Divide a brand's advertising spend, mentions or search volume by the total for the whole category, then multiply by 100. For example, a brand's spend as a proportion of the category's total spend gives its share of voice.
What is excess share of voice (ESOV)?
Excess share of voice is the gap between a brand's share of voice and its share of market, calculated as SOV minus SOM. A positive ESOV means a brand is spending or appearing more than its current market size would suggest, which research links to future growth.
Does share of voice actually predict market share growth?
Yes, multiple independent studies support the link. The IPA Databank analysis found 0.5% annual market share gain per 10 points of ESOV (2007), and Nielsen's study of over 500 brands found growth of 0.4% for SOV-leading brands against shrinkage of 1.3% for SOV-lagging ones (2025).
What is the difference between share of voice and share of search?
Share of voice covers advertising spend, PR and social mentions, while share of search specifically measures the percentage of category Google search volume a brand captures. The IPA Share of Search Think Tank found share of search represents 83% of market share on average, making it a faster proxy for the broader SOV concept (2021).
Is share of voice relevant to small UK businesses, not just large brands?
Yes, though the return differs by size. Larger brands with over 10% market share get roughly 2.5 times greater return from excess share of voice than smaller brands, per Nielsen FMCG analysis via McCann Demand (2026), meaning smaller UK businesses need sharper brand positioning and creative distinctiveness to compete on a smaller budget.
How often should a business measure share of voice?
Most UK marketing teams review paid media SOV quarterly, alongside monthly share of search checks via free tools like Google Trends, since search data updates far faster than advertising spend reports. Reviewing both together helps catch a declining trend before it shows up in sales figures.
Building visibility that lasts with Aether Agency Ltd
Winning share of voice only pays off if the brand people encounter is strong enough to convert that attention into memory and sales, which is precisely where Brand Identity work from Aether Agency Ltd comes in. Building a naming, identity system and set of guidelines that holds together across every channel is what turns a visibility spike into lasting market share gains rather than a wasted media spend.
Aether Agency Ltd has delivered 50+ projects, drawing on a team with 20+ years of combined experience across brand, build and grow. Get in touch with Aether Agency Ltd to discuss how a stronger, more distinctive brand identity can help your business make the most of every point of share of voice it earns.
Related Reading
- Brand Strategy Surrey: Expert Guide for Business Growth 2026
- Brand Strategy Agency Richmond: A UK Buyer's Guide 2026
- Tone of Voice Guide Examples: 12 Brands That Get It Right in 2026
Add aether-agency.co.uk as a preferred source on Google
See How Your Brand Appears in AI Search
Aether AI monitors your visibility across ChatGPT, Perplexity, Google AI Overviews, and Claude in real time. Find out where you stand and what to fix.
Explore Aether AI